Life expectancy depends on where people live in Texas. A new report from the Episcopal Health Foundation (EHF) reveals wide inequalities in life expectancy depending on where you live in Texas.
The data showed the median life expectancy at birth in Texas is 77.8 years. Researchers found an 11-year gap in life expectancy when comparing the bottom 5 percent (<72.1 years) and the top 5 percent of census tracts (>83.3 years).
The gap widens to a nearly 17-year difference when comparing the bottom and top 1 percent of census tracts.
Researchers also found a lower life expectancy in “low-income communities with high rates of poverty, low education attainment, and large scale racial and ethnic minority population (particularly Black populations).”
“Drive 15 minutes through the biggest counties in Texas and you can go from a neighborhood where people usually live more than 85 years to another where the average person dies before he or she is 65,” said Elena Marks, president, and CEO of EHF.
“These numbers should spark important conversations across the state on how we can all take action to address the non-medical, root causes of these dramatic differences in health.”
This aligns with EHF’s social media campaign, #HealthNotHealthcare. They want to promote awareness on the “social determinants of health” in health policy reform.
In other words, the “conditions in the places where people live, learn, work, and play affect a wide range of health risks and outcomes.”
The report, however, did not indicate what factors contributed to the inequalities in life expectancy.
Marks said the conversation on this data should not just be about access to healthcare, but also about “income, housing, community safety and more.”
This troubling data comes as new Census data shows income inequality on the rise. Affordable housing continues to be an issue in Texas.
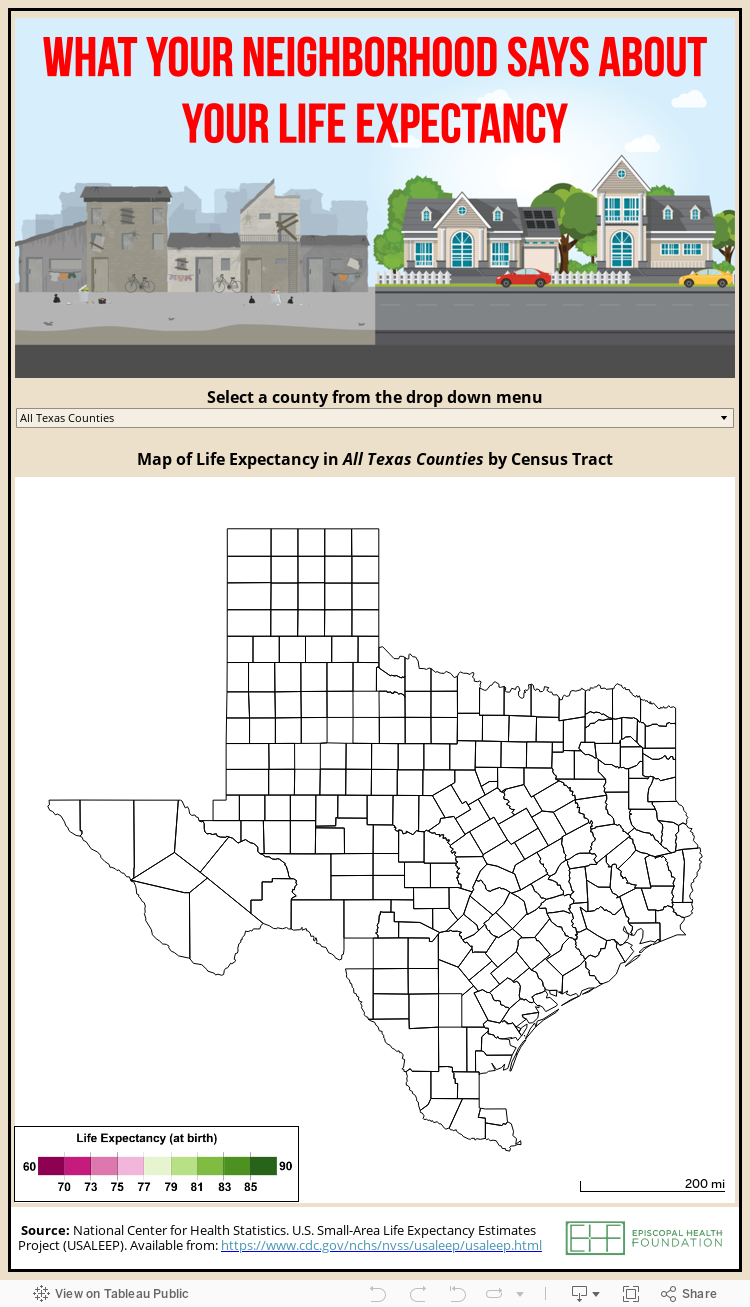
The EHF’s analysis used estimates from the National Center for Health Statistics for 4,709 census tracts across Texas, which covered 89.6 percent of all census tracts due to data limitations.
Part of their report included an interactive mapping tool. Find out your neighborhood’s life expectancy here.